Every year or so there seems to be a redating of a key fossil in human evolution. It's nice to see scientific self-correction in action, and soon after Neandertals got a little older, casting doubt on their supposedly long co-existence with modern humans, we now have a redating of Homo erectus soloensis from Java to about 150-550 thousand years ago, but certainly long before there were any anatomically modern humans in the area.
PLoS ONE 6(6): e21562. doi:10.1371/journal.pone.0021562
The Age of the 20 Meter Solo River Terrace, Java, Indonesia and the Survival of Homo erectus in Asia
Etty Indriati et al.
Homo erectus was the first human lineage to disperse widely throughout the Old World, the only hominin in Asia through much of the Pleistocene, and was likely ancestral to H. sapiens. The demise of this taxon remains obscure because of uncertainties regarding the geological age of its youngest populations. In 1996, some of us co-published electron spin resonance (ESR) and uranium series (U-series) results indicating an age as young as 35–50 ka for the late H. erectus sites of Ngandong and Sambungmacan and the faunal site of Jigar (Indonesia). If correct, these ages favor an African origin for recent humans who would overlap with H. erectus in time and space. Here, we report 40Ar/39Ar incremental heating analyses and new ESR/U-series age estimates from the “20 m terrace" at Ngandong and Jigar. Both data sets are internally consistent and provide no evidence for reworking, yet they are inconsistent with one another. The 40Ar/39Ar analyses give an average age of 546±12 ka (sd±5 se) for both sites, the first reliable radiometric indications of a middle Pleistocene component for the terrace. Given the technical accuracy and consistency of the analyses, the argon ages represent either the actual age or the maximum age for the terrace and are significantly older than previous estimates. Most of the ESR/U-series results are older as well, but the oldest that meets all modeling criteria is 143 ka+20/−17. Most samples indicated leaching of uranium and likely represent either the actual or the minimum age of the terrace. Given known sources of error, the U-series results could be consistent with a middle Pleistocene age. However, the ESR and 40Ar/39Ar ages preclude one another. Regardless, the age of the sites and hominins is at least bracketed between these estimates and is older than currently accepted.
Link

June 30, 2011
June 27, 2011
Basques (?) in 1000 Genomes IBS (Iberian Spanish) sample
I am looking at the population portraits of the Dodecad v3 results (all of which will be provided as a zip once I finish calculating averages), and I discovered an interesting presence of presumably Basque individuals in the 1000 Genomes IBS sample.
First, here are the Dodecad Spanish:

And, the Behar et al. (2010) Spaniards:

And, the HGDP French Basque:

Notice that they are composed almost entirely of "West European" and "Mediterranean" components.
Here is IBS:

Notice a few individuals that resemble Basques. I haven't found a description of the origin of the IBS individuals, but I would wager that a few Basque individuals are included, that resemble their French co-ethnics.
June 26, 2011
Modeling spread of R1b1b2 into Europe
A few comments:
I don't really get how the authors came up with their three models:
Wave-of-Advance Models of the Diffusion of the Y Chromosome Haplogroup R1b1b2 in Europe
Per Sjödin1, Olivier François
Abstract
Whether or not the spread of agriculture in Europe was accompanied by movements of people is a long-standing question in archeology and anthropology, which has been frequently addressed with the help of population genetic data. Estimates on dates of expansion and geographic origins obtained from genetic data are however sensitive to the calibration of mutation rates and to the mathematical models used to perform inference. For instance, recent data on the Y chromosome haplogroup R1b1b2 (M269) have either suggested a Neolithic origin for European paternal lineages or a more ancient Paleolithic origin depending on the calibration of Y-STR mutation rates. Here we examine the date of expansion and the geographic origin of hgR1b1b2 considering two current estimates of mutation rates in a total of fourteen realistic wave-of-advance models. We report that a range expansion dating to the Paleolithic is unlikely to explain the observed geographical distribution of microsatellite diversity, and that whether the data is informative with respect to the spread of agriculture in Europe depends on the mutation rate assumption in a critical way.
Link
I don't really get how the authors came up with their three models:
- the "Paleolithic" model assumes beginning of expansion at 21 kBP; as this was unsupported under any mutation rate, I won't bother with it further.
- the "Neolithic" models had expansion beginning at 10.5kBP, that is about 2k prior to the known earliest colonization of Europe from Anatolia, that occurred around 6,700 years BC.
- the "recent" model has the expansion starting at 3kBP, but already at 3kBP R1b1b2 makes its earliest appearance at Lichtenstein in Germany, and indeed 3kBP takes us to the Iron Age, a period extremely unlikely to have been one of major dispersals into Europe, dispersals that could not have gone unnoticed by the literate civilizations of the time.
Here is what the authors have to say:
Our results show that an expansion in Neolithic or Mesolithic times (350 generations ago or 10 ky) leads to a lower sum of squared errors than post-glacial re-expansion started 700 generations ago (21 ky ago), regardless of assuming a GMR or EMR model (Figure 2 and Table 2). Using GMRs, simulations of recent (100 generations ago) and rapid expansions from three distinct origins provided a better fit to the geographical distribution of microsatellite diversity than did models with expansion started 350 generations ago. Although models of recent origins using GMRs provided poorer fit than a model of Neolithic expansion using the EMR (Figure 2 and Table 2), the small observed difference makes them however difficult to discriminate (odd ratio = 1.7; Figure 3).So, basically the "evolutionary" rate stands its own against the "germline" rate assuming that the Neolithic expansion started 2,000 years before it did, and using the "germline" rate for an expansion at a much later time than anyone would believe.
Not directly related to the paper, I looked at the ongoing Dodecad v3 results to possibly correlate the spread of R-M269 to Western Europe with the autosomal evidence. It appears that the "West European" autosomal component shows a stronger relationship to the "West Asian" one than the "East European" one. This is consistent with an episode of gene flow into Europe from West Asia that affected Western more than Eastern Europe, which parallels the R-M269 distribution in Europe.
More interestingly, I had previously traced a peculiar "Dagestan component" in Europe that, counter-intuitively, seemed to be maximized in the Northwest. Looking at the recent Caucasus Y-chromosome paper, I notice the presence of R-M269 in the Lezgins of Dagestan (~29.6%), as well as the Abkhaz (12.1%). Looking at my Dodecad v3 results, I obtain a value of 24.3% of the "West European" component in the Lezgins, and a value of 15.7% in the Adygei, who are linguistically related to the Abkhaz. By contrast, other R1b-rich populations (namely Armenians and Turks) from West Asia show no substantial evidence of the "West European" component.
PLoS ONE 6(6): e21592. doi:10.1371/journal.pone.0021592
Wave-of-Advance Models of the Diffusion of the Y Chromosome Haplogroup R1b1b2 in Europe
Per Sjödin1, Olivier François
Abstract
Whether or not the spread of agriculture in Europe was accompanied by movements of people is a long-standing question in archeology and anthropology, which has been frequently addressed with the help of population genetic data. Estimates on dates of expansion and geographic origins obtained from genetic data are however sensitive to the calibration of mutation rates and to the mathematical models used to perform inference. For instance, recent data on the Y chromosome haplogroup R1b1b2 (M269) have either suggested a Neolithic origin for European paternal lineages or a more ancient Paleolithic origin depending on the calibration of Y-STR mutation rates. Here we examine the date of expansion and the geographic origin of hgR1b1b2 considering two current estimates of mutation rates in a total of fourteen realistic wave-of-advance models. We report that a range expansion dating to the Paleolithic is unlikely to explain the observed geographical distribution of microsatellite diversity, and that whether the data is informative with respect to the spread of agriculture in Europe depends on the mutation rate assumption in a critical way.
Link
June 25, 2011
Interpretation of ADMIXTURE results: component sharing
I had previously issued a note of caution on admixture estimates. In the present, I will touch upon another subject, namely, what does it mean when two populations share an inferred ancestral component?
It is a common tendency to think in terms of gene flow from the population where the component occurs at a high fraction (say 50%), towards the one where it occurs at a low one (say 10%). But, in reality, component sharing has four possible interpretations:
- Gene flow from the high-fraction to the low-fraction group
- Gene flow from the low-fraction to the high fraction group
- Gene flow from an unsampled third group to both
- Common ancestry of the two groups without substantial gene flow after the initial divergence
1. Gene flow from the high-fraction to the low-fraction group

In the first example, we have three populations: it appears that the population in the middle is admixed, and is composed of a minority element from the one on the left (light grey) and a majority element from the one on the right (dark grey). Indeed, this is what happened, and the middle population (African Americans, ASW) is a mix of white Americans (CEU), and West Africans (YRI).
2. Gene flow from the low-fraction to the high fraction group

This is much like the previous figure, where it appears that the middle group is admixed, while the left and right ones are unadmixed. In reality, the middle group are Anatolian Turks, the left one are Sardinians, and the right one are Gujarati Indians, and the explanation that the former are the result of admixture between the two groups is much less plausible than the alternative that both Sardinians and Gujarati Indians have experienced gene flow from Anatolia, due, e.g., to the spread of the Neolithic economy.
Note, also, that this does not exclude the possibility that some gene flow from Western Europe and South Asia did take place! However, one would be remiss if they interpreted the observed pattern as gene flow from the high fraction groups (Sardinians and Gujaratis) to the low fraction one (Anatolian Turks) and not the opposite.
3. Gene flow from an unsampled third group to both

Here it appears that some individuals from the light grey population have admixture from the dark grey one, and many individuals from the dark grey one have admixture from the light grey one. The two populations are actually Iranians and Ethiopians, and the observed pattern does not necessarily indicate the migration of Persians to Ethiopia or Ethiopians to Persia (although that might have taken place!), but is probably mediated by the geographically intermediate Arabians. Adding the Saudis (right), we obtain the following:

Notice how the "Iranian" component largely disappears from the Ethiopians, and is replaced by the component modal in Saudis. One could, indeed, extend the above, by adding even more groups that may be confounding results, e.g., South Asians in the case of Iranians, or Sub-Saharan Africans in the case of Ethiopians. That is why it's important to sample as broadly as possible, and to include populations bordering one's region of interest.
4. Common ancestry of the two groups without substantial gene flow after the initial divergence

Once again, it appears that there are two relatively "pure" groups and an admixed one, but, in reality, the three groups are Russians, Selkups, and Tongans. It is extremely unlikely that the Selkups from Central Siberia and the Tongans from the South Pacific experienced direct gene flow; the Tongans are believed to be a mix of East Asian-like and Papuan-like people who colonized the Pacific from Southeast Asia and Near Oceania, and any relationship that they have with the Selkups is due to deep common ancestry, rather than more recent gene flow.
Bonus: Lack of visible admixture is not lack of admixture

These three populations, except for three individuals, appear not to share any ancestral components. They are in fact Cambodians, Papuans, and Tongans, and the Tongan population did not appear out of thin air, but is actually derived from Southeast Asia and Near Oceania, from ancestors similar to Cambodians and Papuans.
A good way to see this, is to reduce K=2, which reveals that Tongans are predominantly Cambodian-like, but differ from Cambodians by having some "Papuan" admixture.

Epilogue
I have used ADMIXTURE for months now, and I consider it one of the three best pieces of code a genome blogger may employ (the other being MCLUST, as used in the Galore approach, and, of course, the indispensable PLINK).
ADMIXTURE reveals common ancestral elements in populations, but the interpretation of these elements has to be done with caution:
- Use common sense and background knowledge
- Notice the Fst divergences between components, as these constrain their deep relationships
- Experiment, experiment, experiment with your data
I will probably extend this to not only the ~140 populations with the full set of markers used in Dodecad v3, but also to 100+ more with a smaller number of markers, as well as all unrelated Project participants, encompassing thousands of individuals. So, I am looking forward to hearing peoples' theories on how to interpret the evidence, and, hopefully, the notes of caution in this and my previous posts will be helpful in doing so.
June 23, 2011
Remains of Medieval Jews (?) from Norwich
It would be interesting to see what DNA tests were done on the remains and what were the results.
Jewish bodies found in medieval well in Norwich
Jewish bodies found in medieval well in Norwich
The remains of 17 bodies found at the bottom of a medieval well in England could have been victims of persecution, new evidence has suggested.
The most likely explanation is that those down the well were Jewish and were probably murdered or forced to commit suicide, according to scientists who used a combination of DNA analysis, carbon dating and bone chemical studies in their investigation.
...
History Cold Case: The Bodies in a Wellwill be on BBC Two at 2100 BST on Thursday 23 June 2011 and afterwards in the UK onBBC iPlayer.
Dual origins of cultivated coconuts
 PLoS ONE 6(6): e21143. doi:10.1371/journal.pone.0021143
Independent Origins of Cultivated Coconut (Cocos nucifera L.) in the Old World Tropics
Bee F. Gunn et al.
As a portable source of food, water, fuel, and construction materials, the coconut (Cocos nucifera L.) played a fundamental role in human migrations and the development of civilization across the humid tropics. Here we investigated the coconut's domestication history and its population genetic structure as it relates to human dispersal patterns. A sample of 1,322 coconut accessions, representing the geographical and phenotypic diversity of the species, was examined using ten microsatellite loci. Bayesian analyses reveal two highly genetically differentiated subpopulations that correspond to the Pacific and Indo-Atlantic oceanic basins. This pattern suggests independent origins of coconut cultivation in these two world regions, with persistent population structure on a global scale despite long-term human cultivation and dispersal. Pacific coconuts show additional genetic substructure corresponding to phenotypic and geographical subgroups; moreover, the traits that are most clearly associated with selection under human cultivation (dwarf habit, self-pollination, and “niu vai” fruit morphology) arose only in the Pacific. Coconuts that show evidence of genetic admixture between the Pacific and Indo-Atlantic groups occur primarily in the southwestern Indian Ocean. This pattern is consistent with human introductions of Pacific coconuts along the ancient Austronesian trade route connecting Madagascar to Southeast Asia. Admixture in coastal east Africa may also reflect later historic Arab trading along the Indian Ocean coastline. We propose two geographical origins of coconut cultivation: island Southeast Asia and southern margins of the Indian subcontinent.
Link
June 21, 2011
Enhancements to ADMIXTURE algorithm
It's good to have a new paper on ADMIXTURE which documents some of the features of the newest version of the software. I don't see much in this that you could not already find in the user manual; I was hoping for some more discussion on penalized likelihood, but not much can be found on the topic.
BMC Bioinformatics 2011, 12:246doi:10.1186/1471-2105-12-246
Enhancements to the ADMIXTURE Algorithm for Individual Ancestry Estimation
David H Alexander and Kenneth Lange
BMC Bioinformatics 2011, 12:246doi:10.1186/1471-2105-12-246
Abstract (provisional)
Background
The estimation of individual ancestry from genetic data has become essential to applied population genetics and genetic epidemiology. Software programs for calculating ancestry estimates have become essential tools in the geneticist's analytic arsenal.
Results
Here we describe four enhancements to ADMIXTURE, a high-performance tool for estimating individual ancestries and population allele frequencies from SNP (single nucleotide polymorphism) data. First, ADMIXTURE can be used to estimate the number of underlying populations through cross-validation. Second, individuals of known ancestry can be exploited in supervised learning to yield more precise ancestry estimates. Third, by penalizing small admixture coefficients for each individual, one can encourage model parsimony, often yielding more interpretable results for small datasets or datasets with large numbers of ancestral populations. Finally, by exploiting multiple processors, large datasets can be analyzed even more rapidly.
Conclusions
The enhancements we have described make ADMIXTURE a more accurate, efficient, and versatile tool for ancestry estimation.
BMC Bioinformatics 2011, 12:246doi:10.1186/1471-2105-12-246
Enhancements to the ADMIXTURE Algorithm for Individual Ancestry Estimation
David H Alexander and Kenneth Lange
BMC Bioinformatics 2011, 12:246doi:10.1186/1471-2105-12-246
Abstract (provisional)
Background
The estimation of individual ancestry from genetic data has become essential to applied population genetics and genetic epidemiology. Software programs for calculating ancestry estimates have become essential tools in the geneticist's analytic arsenal.
Results
Here we describe four enhancements to ADMIXTURE, a high-performance tool for estimating individual ancestries and population allele frequencies from SNP (single nucleotide polymorphism) data. First, ADMIXTURE can be used to estimate the number of underlying populations through cross-validation. Second, individuals of known ancestry can be exploited in supervised learning to yield more precise ancestry estimates. Third, by penalizing small admixture coefficients for each individual, one can encourage model parsimony, often yielding more interpretable results for small datasets or datasets with large numbers of ancestral populations. Finally, by exploiting multiple processors, large datasets can be analyzed even more rapidly.
Conclusions
The enhancements we have described make ADMIXTURE a more accurate, efficient, and versatile tool for ancestry estimation.
June 20, 2011
Ancient links between Siberians and Native Americans
J Hum Genet. 2011 Jun 16. doi: 10.1038/jhg.2011.64. [Epub ahead of print]
Ancient links between Siberians and Native Americans revealed by subtyping the Y chromosome haplogroup Q1a.
Malyarchuk B, Derenko M, Denisova G, Maksimov A, Wozniak M, Grzybowski T, Dambueva I, Zakharov I.
Abstract
To investigate the structure of Y chromosome haplogroups R-M207 and Q-M242 in human populations of North Asia, we have performed high-resolution genotyping using both single nucleotide polymorphisms and short tandem repeat (STR)-based approaches of 121 M207- and M242-derived samples from 885 males of 16 ethnic groups of Siberia and East Asia. As a result, the following Y chromosome haplogroups were revealed: R1b1b1-M73 (2.0%), R1b1b2-M269 (0.7%), R2-M124 (1.1%), Q1a(*)-MEH2 (0.5%), Q1a2-M25 (0.1%), Q1a3(*)-M346 (9.2%) and Q1a3a-M3 (0.2%). Despite the low coalescence age of haplogroup Q1a3(*)-M346, which is estimated in South Siberia as about 4.5±1.5 thousand years ago (Ka), divergence time between these Q1a3(*)-M346 haplotypes and Amerindian-specific haplogroup Q1a3a-M3 is equal to 13.8±3.9 Ka, pointing to a relatively recent entry date to America. In addition, unique cluster of haplotypes belonging to Q1a(*)-MEH2 was found in Koryaks inhabiting the Sea of Okhotsk coast (at a frequency of 10.3%). Although the level of STR diversity associated with Q1a(*)-MEH2 is very low, this lineage appears to be closest to the extinct Palaeo-Eskimo individuals belonging to the Saqqaq culture arisen in the New World Arctic about 5.5 Ka. This finding suggests that Q1a(*)-MEH2 likely traces a population migration originating in Northeast Siberia across the Bering Strait.
Link
June 18, 2011
Stature and robusticity during the Neolithic transition: population replacement, not necessarily declining health
First of all, I would like to say that I don't doubt that the Neolithic transition led to a deterioration in health. Contrary to the authors of this paper who suggest that this is "counterintuitive", it would be unexpected if it didn't happen: man lived as a hunter-gatherer for millions of years, and all of the sudden converted to a new lifestyle for which he was not well-suited; it would be surprising if his health did not deteriorate. A good analogy is what is happening right now in much of the world as it undergoes a transition from farming to modern technological life: rise in obesity and its attendant problems, various mental illnesses, etc.
Second, there is a serious flaw with the general thesis that reduction in stature and robusticity was the product of the agricultural transition, as this requires the additional hypothesis that foragers and their succeeding farmers in the same region were the same people. What we are slowly beginning to learn is that they were, in fact, not, and that there have been massive population replacements, beginning with the Neolithic in much of the world.
Econ Hum Biol. 2011 Jul;9(3):284-301. Epub 2011 Apr 1.
Second, there is a serious flaw with the general thesis that reduction in stature and robusticity was the product of the agricultural transition, as this requires the additional hypothesis that foragers and their succeeding farmers in the same region were the same people. What we are slowly beginning to learn is that they were, in fact, not, and that there have been massive population replacements, beginning with the Neolithic in much of the world.
So, for example, the fact that Neolithic Europeans were shorter than so-called Cro-Magnons is not, so much caused by agriculture, but by the fact that Neolithic Europeans were derived from a people that lived in a hotter climate and were thus smaller-bodied in accordance with Bergmann's Rule. This is consistent, also with the observation (found in the paper) of the Portuguese data not following the general pattern, as Portugal's pre-farming population was not as tall as pre-farmers in more northern latitudes.
So, while it is probably true (and expected) that the agricultural transition was a stressful event for the human species, caution must be exercised when interpreting the pattern of change.
Econ Hum Biol. 2011 Jul;9(3):284-301. Epub 2011 Apr 1.
Stature and robusticity during the agricultural transition: Evidence from the bioarchaeological record.
Mummert A, Esche E, Robinson J, Armelagos GJ.
Abstract
The population explosion that followed the Neolithic revolution was initially explained by improved health experiences for agriculturalists. However, empirical studies of societies shifting subsistence from foraging to primary food production have found evidence for deteriorating health from an increase in infectious and dental disease and a rise in nutritional deficiencies. In Paleopathology at the Origins of Agriculture (Cohen and Armelagos, 1984), this trend towards declining health was observed for 19 of 21 societies undergoing the agricultural transformation. The counterintuitive increase in nutritional diseases resulted from seasonal hunger, reliance on single crops deficient in essential nutrients, crop blights, social inequalities, and trade. In this study, we examined the evidence of stature reduction in studies since 1984 to evaluate if the trend towards decreased health after agricultural transitions remains. The trend towards a decrease in adult height and a general reduction of overall health during times of subsistence change remains valid, with the majority of studies finding stature to decline as the reliance on agriculture increased. The impact of agriculture, accompanied by increasing population density and a rise in infectious disease, was observed to decrease stature in populations from across the entire globe and regardless of the temporal period during which agriculture was adopted, including Europe, Africa, the Middle East, Asia, South America, and North America.
Link
Early anatomically modern humans (32,000 years BP) from Buran-Kaya III (Ukraine)
PLoS ONE 6(6): e20834. doi:10.1371/journal.pone.0020834
The Oldest Anatomically Modern Humans from Far Southeast Europe: Direct Dating, Culture and Behavior
Sandrine Prat et al.
Abstract
Background
Anatomically Modern Humans (AMHs) are known to have spread across Europe during the period coinciding with the Middle to Upper Paleolithic transition. Whereas their dispersal into Western Europe is relatively well established, evidence of an early settlement of Eastern Europe by modern humans are comparatively scarce.
Methodology/Principal Finding
Based on a multidisciplinary approach for the study of human and faunal remains, we describe here the oldest AMH remains from the extreme southeast Europe, in conjunction with their associated cultural and paleoecological background. We applied taxonomy, paleoecology, and taphonomy combined with geomorphology, stratigraphy, archeology and radiocarbon dating. More than 160 human bone remains have been discovered. They originate from a well documented Upper Paleolithic archeological layer (Gravettian cultural tradition) from the site of Buran-Kaya III located in Crimea (Ukraine). The combination of non-metric dental traits and the morphology of the occipital bones allow us to attribute the human remains to Anatomically Modern Humans. A set of human and faunal remains from this layer has been radiocarbon dated by Accelerator Mass Spectrometry. The direct-dating results of human bone establish a secure presence of AMHs at 31,900+240/−220 BP in this region. They are the oldest direct evidence of the presence of AMHs in a well documented archeological context. Based on taphonomical observations (cut marks and distribution of skeletal elements), they represent the oldest Upper Paleolithic modern humans from Eastern Europe, showing post-mortem treatment of the dead as well.
Conclusion/Significance
These findings are essential for the debate on the spread of modern humans in Europe during the Upper Paleolithic, as well as their cultural behaviors.
Link
June 17, 2011
Parallel adaptive divergence in human populations
PLoS Genet 7(6): e1002127. doi:10.1371/journal.pgen.1002127
Parallel Adaptive Divergence among Geographically Diverse Human Populations
Jacob A. Tennessen, Joshua M. Akey
Few genetic differences between human populations conform to the classic model of positive selection, in which a newly arisen mutation rapidly approaches fixation in one lineage, suggesting that adaptation more commonly occurs via moderate changes in standing variation at many loci. Detecting and characterizing this type of complex selection requires integrating individually ambiguous signatures across genomically and geographically extensive data. Here, we develop a novel approach to test the hypothesis that selection has favored modest divergence at particular loci multiple times in independent human populations. We find an excess of SNPs showing non-neutral parallel divergence, enriched for genic and nonsynonymous polymorphisms in genes encompassing diverse and often disease related functions. Repeated parallel evolution in the same direction suggests common selective pressures in disparate habitats. We test our method with extensive coalescent simulations and show that it is robust to a wide range of demographic events. Our results demonstrate phylogenetically orthogonal patterns of local adaptation caused by subtle shifts at many widespread polymorphisms that likely underlie substantial phenotypic diversity.
Link
June 16, 2011
Y-chromosomes and mtDNA from medieval Aragonese Pyrenees
I don't see the full article in the journal site yet.
Croat Med J. 2011 Jun 15;52(3):336-43.
Genetic analysis of 7 medieval skeletons from the Aragonese Pyrenees.
Nunez C, Sosa C, Baeta M, Geppert M, Turnbough M, Phillips N, Casalod Y, Bolea M, Roby R, Budowle B, Martínez-Jarreta B.
Aim. To perform a genetic characterization of 7 skeletons from medieval age found in a burial site in the Aragonese Pyrenees. Methods. Allele frequencies of autosomal short tandem repeats (STR) loci were determined by 3 different STR systems. Mitochondrial DNA (mtDNA) and Y-chromosome haplogroups were determined by sequencing of the hypervariable segment 1 of mtDNA and typing of phylogenetic Y chromosome single nucleotide polymorphisms (Y-SNP) markers, respectively. Possible familial relationships were also investigated. Results. Complete or partial STR profiles were obtained in 3 of the 7 samples. Mitochondrial DNA haplogroup was determined in 6 samples, with 5 of them corresponding to the haplogroup H and 1 to the haplogroup U5a. Y-chromosome haplogroup was determined in 2 samples, corresponding to the haplogroup R. In one of them, the sub-branch R1b1b2 was determined. mtDNA sequences indicated that some of the individuals could be maternally related, while STR profiles indicated no direct family relationships. Conclusions. Despite the antiquity of the samples and great difficulty that genetic analyses entail, the combined use of autosomal STR markers, Y-chromosome informative SNPs, and mtDNA sequences allowed us to genotype a group of skeletons from the medieval age.
Link
Croat Med J. 2011 Jun 15;52(3):336-43.
Genetic analysis of 7 medieval skeletons from the Aragonese Pyrenees.
Nunez C, Sosa C, Baeta M, Geppert M, Turnbough M, Phillips N, Casalod Y, Bolea M, Roby R, Budowle B, Martínez-Jarreta B.
Abstract
Aim. To perform a genetic characterization of 7 skeletons from medieval age found in a burial site in the Aragonese Pyrenees. Methods. Allele frequencies of autosomal short tandem repeats (STR) loci were determined by 3 different STR systems. Mitochondrial DNA (mtDNA) and Y-chromosome haplogroups were determined by sequencing of the hypervariable segment 1 of mtDNA and typing of phylogenetic Y chromosome single nucleotide polymorphisms (Y-SNP) markers, respectively. Possible familial relationships were also investigated. Results. Complete or partial STR profiles were obtained in 3 of the 7 samples. Mitochondrial DNA haplogroup was determined in 6 samples, with 5 of them corresponding to the haplogroup H and 1 to the haplogroup U5a. Y-chromosome haplogroup was determined in 2 samples, corresponding to the haplogroup R. In one of them, the sub-branch R1b1b2 was determined. mtDNA sequences indicated that some of the individuals could be maternally related, while STR profiles indicated no direct family relationships. Conclusions. Despite the antiquity of the samples and great difficulty that genetic analyses entail, the combined use of autosomal STR markers, Y-chromosome informative SNPs, and mtDNA sequences allowed us to genotype a group of skeletons from the medieval age.
Link
June 15, 2011
Ancient mtDNA from Wadi el-Makkukh
Mediterranean Archaeology and Archaeometry, Vol. 10, No. 2, pp. 1‐14
ANCIENT mtDNA SEQUENCES AND RADIOCARBON DATING OF HUMAN BONES FROM THE CHALCOLITHIC CAVES OF WADI EL‐MAKKUKH
Salamon, M et al.
DNA from fossil human bones can provide valuable information for understanding intra‐ and
inter‐population relationships. Using the DNA preserved inside crystal aggregates from human fos‐
sil bones containing relatively large amounts of collagen, we demonstrate the presence of repro‐
ducible mtDNA control region sequences. Radiocarbon dates from each bone show that the burial
caves were used for up to 600 years during the Chalcolithic period (5th‐4th millennium BP). A com‐
parison of the ancient DNA sequences with modern mtDNA databases indicates that all samples
can most likely be assigned to the R haplogroup sub‐clades, which are common in West‐Eurasia. In
four cases more precise and confident haplogroup identifications could be achieved (H, U3a and
H6). The H haplogroup is present in three out of the four assigned ancient samples. This hap‐
logroup is prevalent today in West – Eurasia. The results reported here tend to genetically link this
Chalcolithic group of individuals to the current West Eurasian populations.
Link (pdf)
Tai and Mon-Khmer of northern Thailand
BMC Genetics 2011, 12:56doi:10.1186/1471-2156-12-56
Genetic structure of the Mon-Khmer speaking groups and their affinity to the neighbouring Tai populations in Northern Thailand
Wibhu Kutanan et al.
Background
The Mon-Khmer speaking peoples inhabited northern Thailand before the arrival of the Tai speaking people from southern China in the thirteenth century A.D. Historical and anthropological evidence suggests a close relationship between the Mon-Khmer groups and the present day majority northern Thai groups. In this study, mitochondrial and Y-chromosomal DNA polymorphisms in more than 800 volunteers from eight Mon-Khmer and ten Tai speaking populations were investigated to estimate the degree of genetic divergence between these major linguistic groups and their internal structure.
Results
A large fraction of genetic variation is observed within populations (about 80% and 90 % for mtDNA and the Y-chromosome, respectively). The genetic divergence between populations is much higher in Mon-Khmer than in Tai speaking groups, especially at the paternally inherited markers. The two major linguistic groups are genetically distinct, but only for a marginal fraction (1 to 2 %) of the total genetic variation. Genetic distances between populations correlate with their linguistic differences, whereas the geographic distance does not explain the genetic divergence pattern.
Conclusions
The Mon-Khmer speaking populations in northern Thailand exhibited the genetic divergence among each other and also when compared to Tai speaking peoples. The different drift effects and the post-marital residence patterns between the two linguistic groups are the explanation for a small but significant fraction of the genetic variation pattern within and between them.
Link
June 13, 2011
Interview about Morton skull collection @ Penn
This was the topic of a recent article which rehabilitated Morton and exposed Stephen Jay Gould's scientific misconduct.
Autosomal mutation rate from family trios
Razib points me to a new 1000 Genomes Project paper which measures the autosomal mutation directly by looking at trios of individuals (offspring+parents). I don't have much to add except:Nature Genetics (2011) doi:10.1038/ng.862
Variation in genome-wide mutation rates within and between human families
Donald F Conrad et al.
J.B.S. Haldane proposed in 1947 that the male germline may be more mutagenic than the female germline1. Diverse studies have supported Haldane's contention of a higher average mutation rate in the male germline in a variety of mammals, including humans2, 3. Here we present, to our knowledge, the first direct comparative analysis of male and female germline mutation rates from the complete genome sequences of two parent-offspring trios. Through extensive validation, we identified 49 and 35 germline de novo mutations (DNMs) in two trio offspring, as well as 1,586 non-germline DNMs arising either somatically or in the cell lines from which the DNA was derived. Most strikingly, in one family, we observed that 92% of germline DNMs were from the paternal germline, whereas, in contrast, in the other family, 64% of DNMs were from the maternal germline. These observations suggest considerable variation in mutation rates within and between families.
- The authors find substantial family-related variability of the mutation rate. It may be worthwhile to determine whether the mutation rate is a constant across the geographical range of H. sapiens; it is not inconceivable that, if there are family differences in mutability, there may also be population differences.
- The authors estimate the human-chimp divergence at 7 million years. This is reasonably close to the 6.5 million years in last year's papers about Neandertal/Denisovan admixture in modern years, but it is worthwhile to re-examine all past papers with dates dependent on this calibration point. Until now, we had to "fix" human/chimp divergence, and express divergences within Homo and within Homo sapiens as a fraction of that divergence, but our newfound ability to study whole genomes of 1st degree relatives -and soon many more of those- will make it possible to measure the rate directly and not depend on any calibration based on paleontological data.
Variation in genome-wide mutation rates within and between human families
Donald F Conrad et al.
J.B.S. Haldane proposed in 1947 that the male germline may be more mutagenic than the female germline1. Diverse studies have supported Haldane's contention of a higher average mutation rate in the male germline in a variety of mammals, including humans2, 3. Here we present, to our knowledge, the first direct comparative analysis of male and female germline mutation rates from the complete genome sequences of two parent-offspring trios. Through extensive validation, we identified 49 and 35 germline de novo mutations (DNMs) in two trio offspring, as well as 1,586 non-germline DNMs arising either somatically or in the cell lines from which the DNA was derived. Most strikingly, in one family, we observed that 92% of germline DNMs were from the paternal germline, whereas, in contrast, in the other family, 64% of DNMs were from the maternal germline. These observations suggest considerable variation in mutation rates within and between families.
June 10, 2011
mtDNA haplogroup HV1 across the Red Sea
American Journal of Physical Anthropology DOI: 10.1002/ajpa.21522
Population history of the Red Sea—genetic exchanges between the Arabian Peninsula and East Africa signaled in the mitochondrial DNA HV1 haplogroup
Eliška Musilová et al.
Archaeological studies have revealed cultural connections between the two sides of the Red Sea dating to prehistory. The issue has still not been properly addressed, however, by archaeogenetics. We focus our attention here on the mitochondrial haplogroup HV1 that is present in both the Arabian Peninsula and East Africa. The internal variation of 38 complete mitochondrial DNA sequences (20 of them presented here for the first time) affiliated into this haplogroup testify to its emergence during the late glacial maximum, most probably in the Near East, with subsequent dispersion via population expansions when climatic conditions improved. Detailed phylogeography of HV1 sequences shows that more recent demographic upheavals likely contributed to their spread from West Arabia to East Africa, a finding concordant with archaeological records suggesting intensive maritime trade in the Red Sea from the sixth millennium BC onwards. Closer genetic exchanges are apparent between the Horn of Africa and Yemen, while Egyptian HV1 haplotypes seem to be more similar to the Near Eastern ones.
Link
June 09, 2011
Sea Peoples invade: 1192–1190 BC
 Modern methods are slowly helping us build a history of the Heroic Age. The exploits of the Sea Peoples are perhaps not as distinctly preserved in the Greek tradition as those of the Achaeans who sacked Troy, probably sometime during the 1180s BC, with the nostos of Odysseus recently dated to 1,178BC.
 The lack of distinct information may be, in part, due to the fact that the Sea Peoples were active mostly away from the Aegean, and in lands where Greek colonization did not occur centuries later, and hence were cut off from the Aegean world. The memory of the Sea Peoples was best preserved by the native peoples who experienced their presence (such as the Old Testament Hebrews in the case of the Philistines).
From the paper:
By contrasting historical-archaeological and radiocarbon-based data sets, the best candidate for the destruction date of the harbour town is the Sea People invasion. Their presence immediately after the destruction of Gibala is indicated by the material culture of the new settlements on the Tell namely the appearance of Aegean-type architecture, locally-made Mycenaean IIIC Early pottery, hand-made burnished pottery, and Aegean-type loam-weights. These materials, also known from Philistine settlements [24], are cultural markers of foreign settlers, most probably the Sea Peoples.The half millennium between the eruption of Thera in 1,613BC (probably the cause of the Flood tradition of Greek mythology) and the return of the Heraclids to the Peloponnese in 1,104BC (according to Eratosthenes) must have been a remarkable period of change. It truly deserved the special place accorded to it by Hesiod, interjected between the Bronze and Iron Ages. Hopefully, we will have more ancient DNA from this period, from sites around the Eastern Mediterranean, to help better piece together the tumultuous events that so inspired later generations.
PLoS ONE 6(6): e20232. doi:10.1371/journal.pone.0020232
The Sea Peoples, from Cuneiform Tablets to Carbon Dating
David Kaniewski et al.
The 13th century BC witnessed the zenith of the Aegean and Eastern Mediterranean civilizations which declined at the end of the Bronze Age, ~3200 years ago. Weakening of this ancient flourishing Mediterranean world shifted the political and economic centres of gravity away from the Levant towards Classical Greece and Rome, and led, in the long term, to the emergence of the modern western civilizations. Textual evidence from cuneiform tablets and Egyptian reliefs from the New Kingdom relate that seafaring tribes, the Sea Peoples, were the final catalyst that put the fall of cities and states in motion. However, the lack of a stratified radiocarbon-based archaeology for the Sea People event has led to a floating historical chronology derived from a variety of sources spanning dispersed areas. Here, we report a stratified radiocarbon-based archaeology with anchor points in ancient epigraphic-literary sources, Hittite-Levantine-Egyptian kings and astronomical observations to precisely date the Sea People event. By confronting historical and science-based archaeology, we establish an absolute age range of 1192–1190 BC for terminal destructions and cultural collapse in the northern Levant. This radiocarbon-based archaeology has far-reaching implications for the wider Mediterranean, where an elaborate network of international relations and commercial activities are intertwined with the history of civilizations.
Link
June 08, 2011
Stephen Jay Gould: incompetent or biased?
Razib points me to a new article which re-examines Stephen Jay Gould's perceived bias in the study of human cranial volume by the 19th century scientist Samuel George Morton. Gould asserted that Morton:
PLoS Biol 9(6): e1001071. doi:10.1371/journal.pbio.1001071
The Mismeasure of Science: Stephen Jay Gould versus Samuel George Morton on Skulls and Bias
Jason E. Lewis et al.
Stephen Jay Gould, the prominent evolutionary biologist and science historian, argued that “unconscious manipulation of data may be a scientific norm” because “scientists are human beings rooted in cultural contexts, not automatons directed toward external truth” [1], a view now popular in social studies of science [2]–[4]. In support of his argument Gould presented the case of Samuel George Morton, a 19th-century physician and physical anthropologist famous for his measurements of human skulls. Morton was considered the objectivist of his era, but Gould reanalyzed Morton's data and in his prize-winning book The Mismeasure of Man [5] argued that Morton skewed his data to fit his preconceptions about human variation. Morton is now viewed as a canonical example of scientific misconduct. But did Morton really fudge his data? Are studies of human variation inevitably biased, as per Gould, or are objective accounts attainable, as Morton attempted? We investigated these questions by remeasuring Morton's skulls and reexamining both Morton's and Gould's analyses. Our results resolve this historical controversy, demonstrating that Morton did not manipulate data to support his preconceptions, contra Gould. In fact, the Morton case provides an example of how the scientific method can shield results from cultural biases.
Link
- Physically mismeasured skulls so that their cranial volumes would match his expectations about racial differences in cranial volume
- Statistically manipulated population means by taking averages of individual skulls rather than averages of population averages, hence biasing his "Indian" means to be lower
Furthermore, they show that Morton's supposed statistical manipulation had very little effect: the difference was only 0.3 cubic inches. Not only this, but Gould fudged his own measurements which were supposed to proved that different populations did not differ in cranial capacity:
Gould's reanalysis of Morton's 1849 shot-based data resulted in a Native American mean capacity of 86 in3 rather than Morton's original 79 in3. Gould obtained his new average by again taking the group mean of Native American populations with four or more crania. But Gould also applied an additional restriction: he only included Native American crania that Morton had also previously measured with seed. This restriction is entirely arbitrary on Gould's part, as Morton's publications and analyses for his seed- and shot-based measurements are completely separate (1839 versus 1849), and Gould did not apply this restriction to the other groups he reanalyzed in Morton's shot-based data. If this restriction is lifted, Gould's Native American average would be reduced to about 83 in3, considerably below his reported 86 in3.
In other words, Gould's bias is about an order of magnitude higher than Morton's presumed "bias".
It is remarkable that 30 years after the Mismeasurement of Man Gould's errors are uncovered. Why did it take so long? While one could understand why the (totally unfounded but -on the surface- plausible) idea of measurement bias could have gone unnoticed until someone actually re-measured the skulls, but the statistical error that Gould committed was there for anyone to see.
From the paper:
Of the substantive criticisms Gould [1] made of Morton's work, only two are supported here. First, Morton indeed believed in the concept of race and assigned a plethora of different attributes to various groups, often in highly racist fashion. This, however, is readily apparent to anyone reading the opening pages of Morton's Crania Americana. Second, the summary table of Morton's final 1849 catalog [10] has multiple errors (Dataset S3). However, had Morton not made those errors his results would have more closely matched his presumed a priori bias (and see Box 4). Ironically, Gould's own analysis of Morton is likely the stronger example of a bias influencing results [11].First, there is a conflation here between "believing in the concept of race" (which is in no-way invalid, and certainly its validity or lack thereof is not the subject of this paper) and "assigning a plethora of different attributes..." which may indeed be true, but completely irrelevant to the actual quantitative measurements of skulls.
What is most interesting is that Gould's analysis of Morton's work shows clear evidence of bias in favor of his own hypothesis ("Morton was a racist, different races have not much different cranial capacities"), rather than the opposite. Nonetheless, Gould has been viewed by some as some sort of progressive enlightened intellectual, whereas Morton is vilified as a bad scientist who fudged his data because of his racist bias.
Morton may have been a racist, but his data were not provably the product of his racism. Gould was a non-racist, but his data was clearly the product of his biological egalitarianism and/or his quantitative incompetence.
PLoS Biol 9(6): e1001071. doi:10.1371/journal.pbio.1001071
The Mismeasure of Science: Stephen Jay Gould versus Samuel George Morton on Skulls and Bias
Jason E. Lewis et al.
Stephen Jay Gould, the prominent evolutionary biologist and science historian, argued that “unconscious manipulation of data may be a scientific norm” because “scientists are human beings rooted in cultural contexts, not automatons directed toward external truth” [1], a view now popular in social studies of science [2]–[4]. In support of his argument Gould presented the case of Samuel George Morton, a 19th-century physician and physical anthropologist famous for his measurements of human skulls. Morton was considered the objectivist of his era, but Gould reanalyzed Morton's data and in his prize-winning book The Mismeasure of Man [5] argued that Morton skewed his data to fit his preconceptions about human variation. Morton is now viewed as a canonical example of scientific misconduct. But did Morton really fudge his data? Are studies of human variation inevitably biased, as per Gould, or are objective accounts attainable, as Morton attempted? We investigated these questions by remeasuring Morton's skulls and reexamining both Morton's and Gould's analyses. Our results resolve this historical controversy, demonstrating that Morton did not manipulate data to support his preconceptions, contra Gould. In fact, the Morton case provides an example of how the scientific method can shield results from cultural biases.
Link
June 06, 2011
Erectus out of Georgia?
From a Nature News story on the article:
Earliest human occupations at Dmanisi (Georgian Caucasus) dated to 1.85–1.78 Ma
Reid Ferring et al.
The early Pleistocene colonization of temperate Eurasia by Homo erectus was not only a significant biogeographic event but also a major evolutionary threshold. Dmanisi's rich collection of hominin fossils, revealing a population that was small-brained with both primitive and derived skeletal traits, has been dated to the earliest Upper Matuyama chron (ca. 1.77 Ma). Here we present archaeological and geologic evidence that push back Dmanisi's first occupations to shortly after 1.85 Ma and document repeated use of the site over the last half of the Olduvai subchron, 1.85–1.78 Ma. These discoveries show that the southern Caucasus was occupied repeatedly before Dmanisi's hominin fossil assemblage accumulated, strengthening the probability that this was part of a core area for the colonization of Eurasia. The secure age for Dmanisi's first occupations reveals that Eurasia was probably occupied before Homo erectus appears in the East African fossil record.
Link
The presence of a tool-using population on the edge of Europe so early hints that the northern continent, rather than Africa, may have been the evolutionary birthplace of H. erectus. Unfortunately, the fossils of the hominins responsible for making the tools are not proving very helpful to the debate.PNAS doi: 0.1073/pnas.1106638108
Fossilized bone fragments found in the same sedimentary layers as the Dmanisi artefacts are too weathered to be identified as belonging to any one species, so it is impossible to say for sure whether the tools were made by H. erectus.
Neither do fossil skulls previously retrieved from later sediments at the site help to resolve the controversy. These fossils, dating from 1.77 million years ago, had brains between 600 and 775 cubic centimetres in volume, whereas H. erectus is generally thought to have had an average brain size of around 900 cubic centimetres. For comparison, modern humans have a brain capacity of around 1,350 cubic centimetres. "Many people call those Dmanisi fossils the earliest H. erectus, but there is still frequent debate about this," explains Ferring.
Earliest human occupations at Dmanisi (Georgian Caucasus) dated to 1.85–1.78 Ma
Reid Ferring et al.
The early Pleistocene colonization of temperate Eurasia by Homo erectus was not only a significant biogeographic event but also a major evolutionary threshold. Dmanisi's rich collection of hominin fossils, revealing a population that was small-brained with both primitive and derived skeletal traits, has been dated to the earliest Upper Matuyama chron (ca. 1.77 Ma). Here we present archaeological and geologic evidence that push back Dmanisi's first occupations to shortly after 1.85 Ma and document repeated use of the site over the last half of the Olduvai subchron, 1.85–1.78 Ma. These discoveries show that the southern Caucasus was occupied repeatedly before Dmanisi's hominin fossil assemblage accumulated, strengthening the probability that this was part of a core area for the colonization of Eurasia. The secure age for Dmanisi's first occupations reveals that Eurasia was probably occupied before Homo erectus appears in the East African fossil record.
Link
June 05, 2011
Greek horse breeds

Wikipedia article on Skyros pony
Related:
Genet Mol Biol. 2011 Jan;34(1):68-76. Epub 2011 Mar 1.
Genetic variability in the Skyros pony and its relationship with other Greek and foreign horse breeds.
Bömcke E, Gengler N, Cothran EG.
Abstract
In Greece, seven native horse breeds have been identified so far. Among these, the Skyros pony is outstanding through having a distinct phenotype. In the present study, the aim was to assess genetic diversity in this breed, by using different types of genetic loci and available genealogical information. Its relationships with the other Greek, as well as foreign, domestic breeds were also investigated. Through microsatellite and pedigree analysis it appeared that the Skyros presented a similar level of genetic diversity to the other European breeds. Nevertheless, comparisons between DNA-based and pedigree-based results revealed that a loss of genetic diversity had probably already occurred before the beginning of breed registration. Tests indicated the possible existence of a recent bottleneck in two of the three main herds of Skyros pony. Nonetheless, relatively high levels of heterozygosity and Polymorphism Information Content indicated sufficient residual genetic variability, probably useful in planning future strategies for breed conservation. Three other Greek breeds were also analyzed. A comparison of these with domestic breeds elsewhere, revealed the closest relationships to be with the Middle Eastern types, whereas the Skyros itself remained isolated, without any close relationship, whatsoever.
Link
June 03, 2011
Piraeus: the ancient island of Athens
Piraeus, the harbor of Athens used to be an island according to Strabo:This has now been confirmed in a new article. I am reminded of Plato's narrative about how Attica had been affected by soil erosion. His explanation was probably not correct (the soil did not sink to the sea, but sea levels rose in the 9,000 years before his time), but it's fascinating that his description of a much larger Attica was basically correct.
And as for the Peiraeus, it was becaue the Peiraeus was formerly an island and lay "over against" the mainland, they say
Whether due to tradition or the ability to back-project geological phenomena into the past, the Greeks of the classical age certainly knew something about the geological past of their homeland.
Geology doi: 10.1130/G31818.1
Piraeus, the ancient island of Athens: Evidence from Holocene sediments and historical archives
Jean-Philippe Goiran et al.
The famous Greek geographer Strabo wrote in the first century A.D., that Piraeus was formerly an island and lay 'over against' the mainland, from which it got its name. To validate Strabo's hypothesis, cartographic and historical data were compiled with multiproxy paleoenvironmental analyses and radiocarbon dating from a series of boreholes drilled in the Cephissus coastal plain, southwest of Athens, Greece. The results of this interdisciplinary geoarchaeological research demonstrate the reliability of Strabo's text by revealing that Piraeus was indeed an island. In early Holocene time, the rocky hill of Piraeus was linked to the mainland of Attica. During the late to final Neolithic Period (4850–3450 B.C.), Piraeus became an island in a shallow marine bay, due to sea-level rise in the Holocene. Between 2850 and 1550 B.C., in the Early and Middle Bronze Age, Piraeus was separated from the mainland by a wide lagoon. In the fifth century B.C., Themistocles, Cimon, and then Pericles connected Athens to Piraeus by building two "long walls" partly built on a residual coastal marsh called the Halipedon. This study reveals an impressive example of past landscape evolution.
Link
June 02, 2011
Genetic Classification of Populations Using Supervised Learning
Supervised learning involves fitting a model on genetic data using the population labels of individuals. If one is interested in detecting the presence but without supposing the presence of meaningful and distinct clusters of individuals (as I do with the Galore approach), then using the population labels is a big no-no. However, if one adopts a more practical approach of trying to detect difference between actual populations, then using the labels adds value to the classification process.
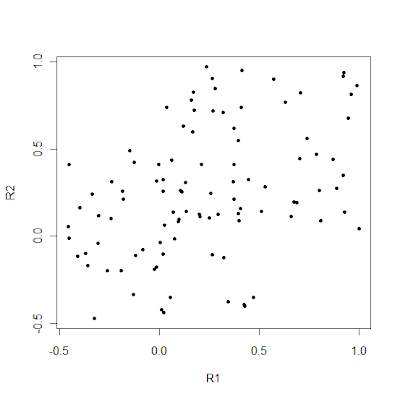
A good way to see the added value of using the labels can be seen with the following simple example:

PLoS ONE 6(5): e1402. doi:10.1371/journal.pone.0014802
Genetic Classification of Populations Using Supervised Learning
Michael Bridges et al.
There are many instances in genetics in which we wish to determine whether two candidate populations are distinguishable on the basis of their genetic structure. Examples include populations which are geographically separated, case–control studies and quality control (when participants in a study have been genotyped at different laboratories). This latter application is of particular importance in the era of large scale genome wide association studies, when collections of individuals genotyped at different locations are being merged to provide increased power. The traditional method for detecting structure within a population is some form of exploratory technique such as principal components analysis. Such methods, which do not utilise our prior knowledge of the membership of the candidate populations. are termed unsupervised. Supervised methods, on the other hand are able to utilise this prior knowledge when it is available.
In this paper we demonstrate that in such cases modern supervised approaches are a more appropriate tool for detecting genetic differences between populations. We apply two such methods, (neural networks and support vector machines) to the classification of three populations (two from Scotland and one from Bulgaria). The sensitivity exhibited by both these methods is considerably higher than that attained by principal components analysis and in fact comfortably exceeds a recently conjectured theoretical limit on the sensitivity of unsupervised methods. In particular, our methods can distinguish between the two Scottish populations, where principal components analysis cannot. We suggest, on the basis of our results that a supervised learning approach should be the method of choice when classifying individuals into pre-defined populations, particularly in quality control for large scale genome wide association studies.
Link

This looks pretty much like a random collection of individuals with not much structure visible. Now, let's add the labels:

It's pretty obvious now, that "red" and "blue" points differ systematically from each other, and one would be able to achieve fairly high classification accuracy among them.
PLoS ONE 6(5): e1402. doi:10.1371/journal.pone.0014802
Genetic Classification of Populations Using Supervised Learning
Michael Bridges et al.
There are many instances in genetics in which we wish to determine whether two candidate populations are distinguishable on the basis of their genetic structure. Examples include populations which are geographically separated, case–control studies and quality control (when participants in a study have been genotyped at different laboratories). This latter application is of particular importance in the era of large scale genome wide association studies, when collections of individuals genotyped at different locations are being merged to provide increased power. The traditional method for detecting structure within a population is some form of exploratory technique such as principal components analysis. Such methods, which do not utilise our prior knowledge of the membership of the candidate populations. are termed unsupervised. Supervised methods, on the other hand are able to utilise this prior knowledge when it is available.
In this paper we demonstrate that in such cases modern supervised approaches are a more appropriate tool for detecting genetic differences between populations. We apply two such methods, (neural networks and support vector machines) to the classification of three populations (two from Scotland and one from Bulgaria). The sensitivity exhibited by both these methods is considerably higher than that attained by principal components analysis and in fact comfortably exceeds a recently conjectured theoretical limit on the sensitivity of unsupervised methods. In particular, our methods can distinguish between the two Scottish populations, where principal components analysis cannot. We suggest, on the basis of our results that a supervised learning approach should be the method of choice when classifying individuals into pre-defined populations, particularly in quality control for large scale genome wide association studies.
Link
Subscribe to:
Posts (Atom)